Profit isn’t always the full story when it comes to gauging success in your small business. Take sales, for example—they’re logged on your profit and loss statement, whether or not you’ve actually received the cash. That’s where the break-even point comes in—it’s a critical metric for understanding your financial situation.
But first, what is a break-even point?
Simply put, it’s a financial marker that shows when your company’s total profits equal its expenses. The idea is that once you hit this point, you’ll gain valuable insights into how your business operates and what steps you can take to consistently exceed your expenses with profits. Your break-even point changes depending on your costs, such as startup expenses, fixed assets, and day-to-day purchases. The more you spend on running your business, the higher your break-even point will be.
That’s why many companies calculate their break-even point on a monthly or yearly basis—or sometimes both. This helps you steer your business towards higher profits and lower expenses, as these factors determine whether you’re just “breaking even” or thriving.
Factors for determining your break-even point
Determining your break-even point involves considering several factors unique to your business. If you’ve made significant capital investments, you’ll need to earn higher profits to cover these costs. Similarly, high raw material and labor expenses can extend the journey to reaching your break-even point. Conversely, if your business operates with minimal overhead, you may reach your break-even point sooner as long as you generate sufficient revenue and set appropriate prices for your services
There are still a few core tenets behind a break-even point calculation, even though each figure is different. These key metrics influence how you determine your break-even point. Your best bet is to create a sales forecast before you dive into a break-even point forecast, as that will give you insights into each of the metrics below.
Average per-unit cost
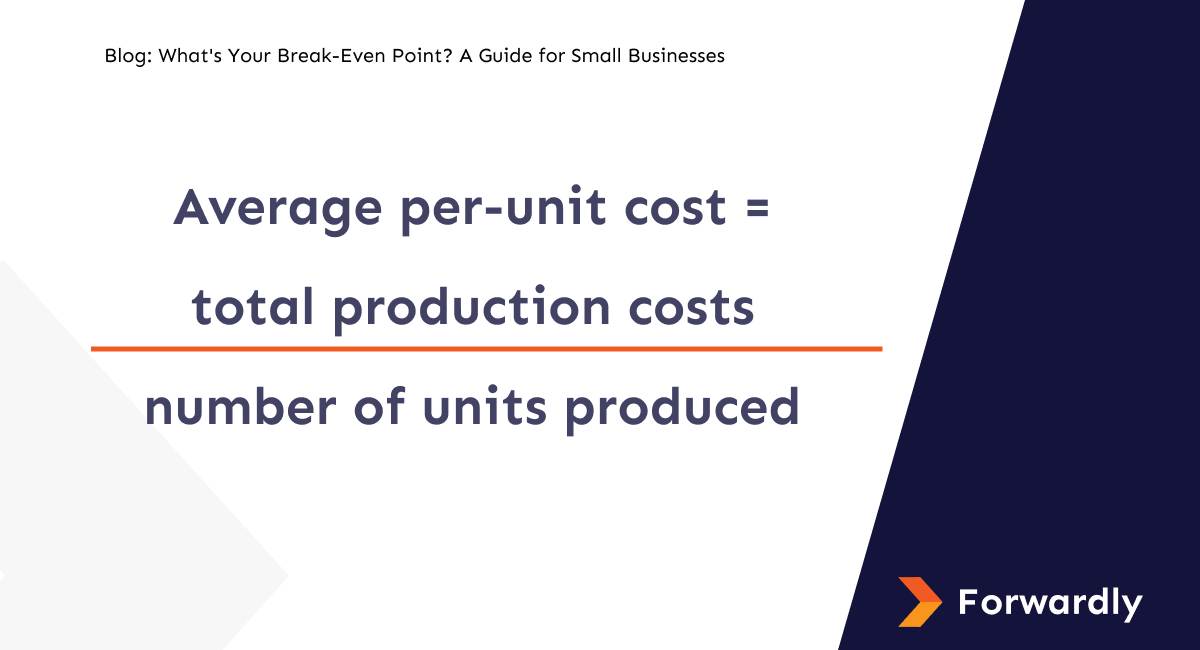
Your average per-unit cost is the amount of money it costs for you to make a single unit (product or service, depending on your business). You’ll typically want your per-unit cost to be as low as possible if you want to maximize your profit margin.
Average per-unit sales price
The average per-unit sales price is the money you receive for every unit you sell. In short, it’s the amount you charge on every sale (or invoice). This stat doesn’t account for taxes, labour, or raw materials costs. It’s just what you take in for every item you sell. Be sure to account for sales and discounts, as these will lower your per-unit sales price. And if you sell more than one item, you’ll have to calculate an average price across all products.
Fixed costs
Fixed costs are the expenses you regularly incur over a set period, like a month, quarter, etc. This includes raw materials, rent/mortgage, payroll, taxes, and any other expenditure that you can count on every month. Fixed costs, also known colloquially as overhead, or the cost of doing business, are recorded in your business’s income statement. You’ll want to make sure your fixed costs are low if you want to make it easier for you to hit your break-even point since your overhead eats into your profits.
Calculating a break-even point: An example
Tara’s Teddy Bears is introducing a line of cute, cuddly mini bears. But what will it take to break even each month for this line alone?
Here’s how Tara worked out her average cost per unit. Based on an estimate from her manufacturer, it will cost $500,000 to produce 1 million tiny teddy bears. Running the formula, this means the average cost per unit is 50¢.

Average per-unit cost = total production costs ÷ number of units produced
$500,000 total production costs÷ 1,000,000 bears = 50¢ per bear
In this example, you’ll be able to see how pricing makes a difference in the ultimate break-even point.
- If she charges $10 a bear, she’ll earn $10,000 in revenue for every 1,000 bears she sells.
- If she charges $15 a bear, she’ll earn $15,000 in revenue for every 1,000 bears she sells.
To get to her break-even point for her new line of bears, Tara runs the numbers, based on $1,000 in monthly fixed costs using the formula below:
Break-even point = fixed costs÷ (per unit price – per unit cost)
- $1,000 ÷ $9.50 = $105.26
With this break-even point, Tara has to sell more than 10 bears at $10 each month in order to cover costs. - $1000 ÷ $14.50 = $68.97
With this break-even point, Tara only needs to sell more than 4 bears a month at $15 each in order to cover costs.
As this isn’t her first product line and she knows that her other product lines all sell 100 units or more each month, she can see that she has the freedom to charge either $10 or $15. Of course, she’ll examine other market factors as well and look at her break-even point for her entire company as well.
Your break-even point and cash flow
Because there are so many moving parts to a business, monitoring your cash flow and the factors that affect it gives you the perspective you need to make future projections and better-informed decisions.
Cash flow analysis that includes a cash flow statement and cash flow forecast helps you compare things like the timing of your income versus the timing of your expenses. It can show you if you’ve got more debt than equity and highlight a range of indicators, ratios and variables.
Hitting your break-even point is only one step toward being cash flow positive and staying that way. It’s simply one piece of the puzzle. However, with Forwardly’s free cash flow forecasting, which offers rolling forecasts for up to 12 months, you can integrate all aspects of your finances. Get started for free here.
 Back to Blog

